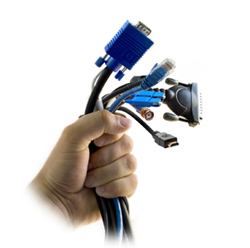
 While not an exact figure, we would estimate that about half our client’s problems with machine vision camera connections, dropped frames, etc. comes back to a cabling issue. This is especially true for USB and GigE cameras.
In most of these cases, the issue is that the user is using a poor/low quality cable that was not made for the high speed and/or long distance demands of the application. Most inexpensive camera cables available via mail order are not made for use in high speed highly reliable data transfer applications. If your phone isn’t transferring at the full USB3 bandwidth, you normally don’t care. You probably don’t even know. But when you purchase a high speed USB3 camera and you can’t achieve its full frame rate, or you achieve it intermittently, this becomes a big issue.
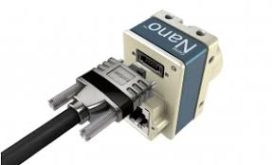
This is the reason 1stVision offers ‘machine vision/industrial’ USB3 and GigE cables. These cables are tested to specs, come with screw locks to prevent the connectors from falling out, use larger gauge wire, are over molded. They are designed to be twisted and bent (somewhat) and are industrial!
Signal amplitude (the voltage of the signal in the cable) is a function of distance and frequency for cables. For instance, Ethernet is specified to 100 meters. So your cable should work when each device is 100 meters away. However, without the proper cable, you will not maintain the full 1000 Mbits/s data transfer rate! You might only be getting 50% of the speed depending upon the distance without a high quality cable.
Finally, consider the cost if your machine vision camera is part of an instrument or product that is being sold to your clients. We see far too many clients who try to save $30 on the cable only to find out that it is costing them thousands of dollars to trouble shoot a problem that can be easily solved with the proper part. Not to mention the cost to their client when the system isn’t working, and a hit to their reputation of not building a reliable system.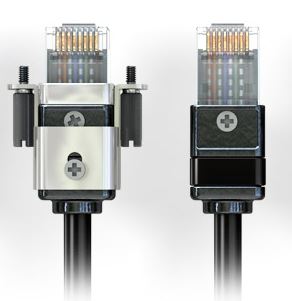
Here is our advice:
- If you are in an industrial setting, you are compromising the reliability and robustness of your system if you are not using an ‘industrial cable’. Even if you are not operating at maximum speed of the camera, you should have these cables. BTW, these cables are not that much more expensive mail order cables. They are in the 10’s of dollars, but not in the 1’s of dollars.
- If you are using USB3 cables, you should really be using ‘industrial’ cables. Current ‘inexpensive’ USB3 cables are not reliable at over 2M, and only 1M for USB C connector types. If you are using USB3 specifically to get the higher speeds from this protocol, then you absolutely need to be using ‘industrial’ cables. Inexpensive cables are not reliable for high speed data transmission.
- If you are in a lab environment, with the cable never moving, and only going a short distance, then a high quality ‘inexpensive’ Cat 6e cable will work. There is a difference between inexpensive Ethernet cables. The one that came with the security camera all folder up is NOT what you should use. A reputable mail order cable vendor selling high quality patch cables is OK.
CLICK HERE to get GigE Cable specs and get a quote
CLICK HERE for USB3 Cable specs and get a quote
Don’t be penny wise and pound foolish. At 1stVision, we offer these cables not to enrich ourselves, there is not much profit in a $30 cable, but rather to make sure our clients systems work well.
1st Vision’s sales engineers have over 100 years of combined experience to assist in your camera selection. With a large portfolio of lenses, cables, NIC card and industrial computers, we can provide a full vision solution!
Contact us to help in the specification and providing pricing
Ph: 978-474-0044 / info@1stvision.com / www.1stvision.com
Related Blogs & Technical resources

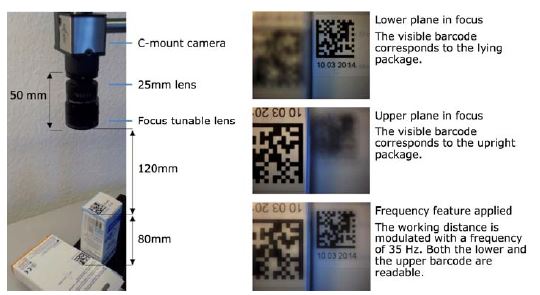
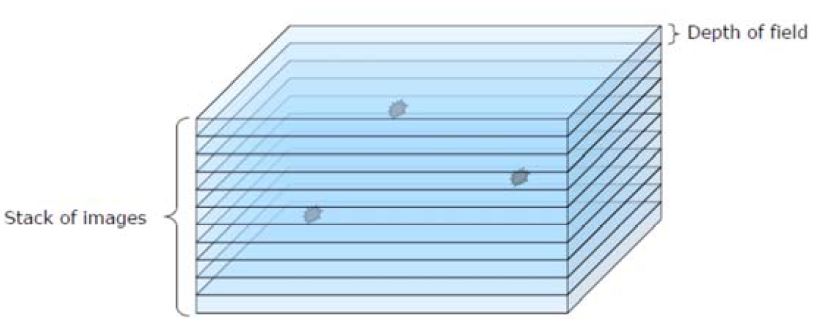
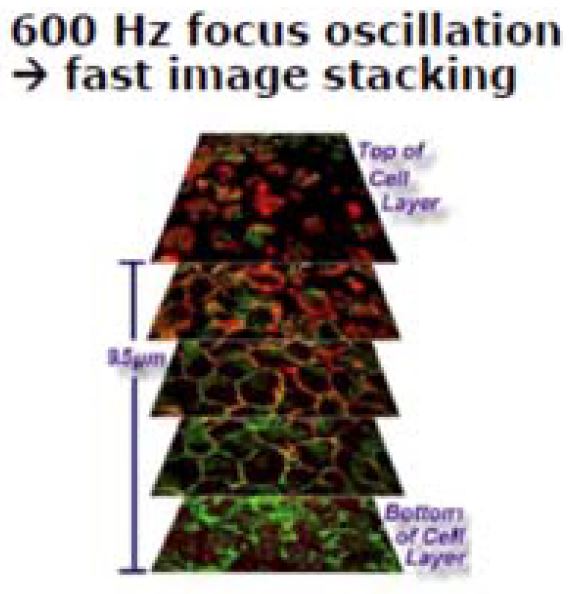
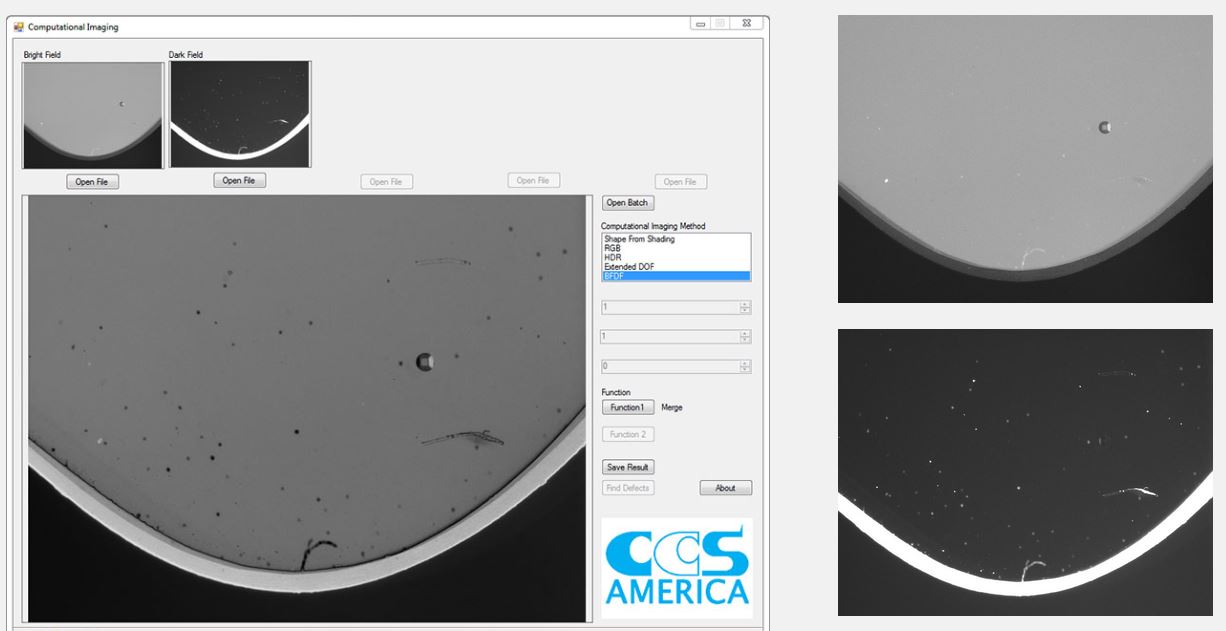
 For this application, a liquid lens is used in conjunction with a telescentric lens taking images through different heights of the lens stack.