How to select an industrial or machine vision camera?

How to select a camera

Why should I read about how to select an industrial camera, when I could just call 1stVision as a distributor of cameras, lenses, lighting, software, and cables, and let you recommend a solution for me?

Well yes, you could – and ultimately we believe a number of you who read this will in fact call us, as have many before. But when you take your car to the mechanic, do you just tell him “sometimes it makes a funny noise”? Or do you qualify the funny noise observation by noting at what speed it happens? When driving straight or turning in one direction? Whether it correlates to the ambient temperature or whether the vehicle is warmed up – or not?

How to select a camera

The best outcomes tend to come from partnerships where both the customer and the provider each bring their knowledge to the table – and work together to characterize the problem, the opportunity, and the solution. In our many years of expertise helping new and returning customers create machine vision solutions, the customers with the best outcomes also make the effort to dig in and understand enough about cameras and other components in order to help us help them.

So how does one in fact choose an industrial or machine vision camera?

An industrial camera is a camera, often embedded in or connected to a system, used for commercial or scientific applications. Additionally, machine systems are often fully automated, or at least partially automated, with long duty cycles. Applications are many, ranging from surveillance, process control, quality control, pick and place, biomedical, manufacturing, and more.

Further, the camera may be moving – or stationary, or the target might be moving – or stationary. And the wavelengths of light best-suited to achieving intended outcomes may be in the visible spectrum – the same spectrum we see – or the application may take advantage of ultraviolet (UV) or infrared (IR) characteristics.

So where to begin? First we need to characterize the application to be developed. Presumably you know or believe there’s an opportunity to add value by using machine vision to automate some process by applying computer controlled imaging to improve quality, reduce cost, innovate a product or service, reduce risk, or otherwise do something useful.

Now let’s dig into each significant consideration, including resolution, sensor selection frame rate, interface, cabling, lighting, lens selection, software, etc. Within each section we have links to more technical details to help you focus on your particular application.

Resolution: This is about the level of detail one needs in the image, in order to achieve success. If one just needs to detect presence or absence, a low resolution image may be sufficient. But if one needs to measure precisely, or detect fine tolerances, one needs a far more pixels that correlate to the fine-grained features from the real-world details being imaged.

The same real-world test chart imaged with better resolution on the left than on the right, due to one or both of sensor characteristics and/or lens quality

A key guideline is that each minimal real-world feature to be detected should appear in a 3×3 pixel grid in the image.  So if the real-world scene is X by Y meters, and the smallest feature to be detected is A by B centimeters, assuming the lens is matched to the sensor and the scene, it’s just a math problem to determine the number of pixels required on the sensor. Read more about resolution requirements and calculations.

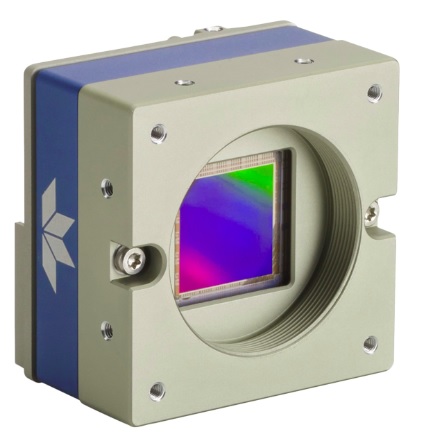
Sensor selection: So the required resolution is an important determinant for sensor selection. But so is sensitivity, including concepts like quantum efficiency. Pixel size matters too, as an influencer on sensitivity, as well as determining sensor size overall. Keys to choosing the best image sensor are covered here.

image sensor

Wavelength: Sensor selection is also influenced based on the wavelengths being using in the application.     Let’s assume you’ve identified the wavelength(s) for the application, which determines whether you’ll need:

  • a CMOS sensor for visible light in the 400 – 700nm range
  • a UV sensor for wavelengths below 400nm
  • a Near Infrared sensor for 750 – 900nm
  • or SWIR and XSWIR to even longer wavelengths up to 2.2µm

Monochrome or color? If your application is in the visible portion of the spectrum, many first-timers to machine vision assume color is better, since it would seem to have more “information”. Sometimes that intuition is correct – when color is the distinguishing feature. But if measurement is the goal, monochrome can be more efficient and cost-effective. Read more about the monochrome vs. color sensor considerations.

Area scan vs. line scan? Area scan cameras are generally considered to be the all-purpose imaging solution as they use a straight-forward matrix of pixels to capture an image of an object, event, or scene. In comparison to line scan cameras, they offer easier setup and alignment. For stationary or slow moving objects, suitable lighting together with a moderate shutter speed can produce excellent images.

In contrast to an area scan camera, in a line scan camera a single row of pixels is used to capture data very quickly. As the object moves past the camera, the complete image is pieced together in the software line-by-line and pixel-by-pixel. Line scan camera systems are the recognized standard for high-speed processing of fast-moving “continuous” objects such as in web inspection of paper, plastic film, and related applications. An overview of area scan vs. line scan.

Frame-rate: If your object is stationary, such as a microscope slide, frame rate may be of little importance to you, as long as the entire image can be transferred from the camera to the computer before the next image needs to be acquired. But if the camera is moving (drive-by-mapping, or camera-on-robot-arm) or the target is moving (fast moving conveyor belt or a surveillance application), one must capture each image fast enough to avoid pixel blur – and transfer the images fast enough to keep up. How to calculate exposure time?

Interfaces: By what interface should the camera and computer communicate? USB, GigE, Camera Link, or CoaXPress? Each has merits but vary by throughput capacity, cable lengths permitted, and cost. It’s a given that the interface has to be fast enough to keep up with the volume of image data coming from the camera, relative to the software’s capability to process the data. One must also consider whether it’s a single-camera application, or one in which two or more cameras will be integrated, and the corresponding interface considerations.

Cabling: So you’ve identified the interface. The camera and computer budget is set. Can you save a bit of cost by sourcing the cables at Amazon or eBay, compared to the robust ones offered by the camera distributor? Sometimes you can! Sometimes not so much.

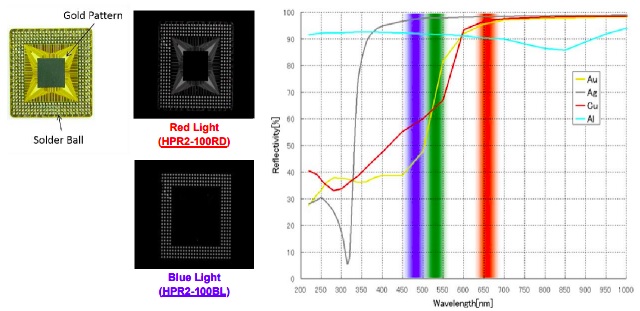
Lighting: While not part of the camera per se, for that sensor you’re now liking in a particular camera model, can you get enough photons into the pixel well to achieve the necessary contrast to discern target from background? While sensor selection is paramount, lighting and lensing are just a half-step behind in terms of consideration with the most bearing on application outcomes. Whether steady LED light or strobed, bright field or dark field, visible or IR or UV, lighting matters. It’s worth understanding.

Filters: Twinned closely with the topic of lighting, well-chosen filters can “condition” the light to polarize it, block or pass certain frequencies, and can generally add significant value. Whether in monochrome, color, or non-visible portions of the spectrum, filters can pay for themselves many times over in improving application outcomes.

Lens selection: Depending on resolution requirements, sensors come in various sizes. While always rectangular in shape, they have differing pixel densities, and differing overall dimensions. One needs to choose a lens that “covers” the light-sensitive sections of the sensor, so be sure to understand lens optical format. Not only does the lens have to be the right size, one also has to pay attention to quality. There’s no need to over-engineer and put a premium lens into a low-resolution application, but you sure don’t want to put a mediocre lens into a demanding application. The Modulation Transfer Function, or MTF, is a good characterization of lens performance, and a great way to compare candidate lenses.

Software: In machine vision systems, it’s the software that interprets the image and takes action, whether that be accept/reject a part, actuate a servo motor, continue filling a bottle or vial, log a quality control image, etc. Most camera providers offer complementary software development kits (SDKs), for those who want to code camera control and image interpretation. Or there are vendor-neutral SDKs and machine vision libraries – these aren’t quite plug-and-play – yet – but they often just require limited parameterization to achieve powerful camera configuration and image processing.

Accessories: How about camera mounts? Wash-down enclosures for food-processing or dusty environments? If used outdoors, do you need heating or cooling, or condensation management? Consider all aspects for a full solution.

1st Vision’s sales engineers have over 100 years of combined experience to assist in your camera and components selection.  With a large portfolio of lensescablesNIC card and industrial computers, we can provide a full vision solution!

Release of Goldeye G/CL-008 XSWIR Cameras

Recently released Goldeye G/CL-008 XSWIR cameras with QVGA resolution extended range InGaAs sensors offer two sensitivity options: up to 1.9 µm or 2.2µm.

Goldeye SWIR camera
From SWIR into Extended SWIR. Image courtesy of Allied Vision Technologies.

The Extended Range (ER) InGaAs sensor technology integrated into the new Goldeye XSWIR models provides high imaging performance beyond 1.7 µm.

The cut-off wavelength can be shifted to higher values by increasing the amount of Indium vs. Gallium in an InGaAs compound. Corresponding sensors can only detect light below the cut-off wavelength. In the Goldeye XSWIR cameras there are four different sensors with VGA and QVGA resolution and cut-off wavelength at 1.9 µm or 2.2 µm that provide very high peak quantum efficiencies of > 75%.

Indium Gallium mix affects cutoff value
Indium : Gallium ratio determines cut-off wavelength; image courtesy of Allied Vision

The new Goldeye XSWIR models are:

Table showing 4 sensor options for Goldeye 008 XSWIR; courtesy of Allied Vision
Contact us for a quote

In these cameras the sensors are equipped with a dual-stage thermo-electric cooler (TEC2) to cool down the sensor temperature by 60K vs. the housing temperature. Also included are image correction capabilities like Non-Uniformity Correction (NUC) and 5×5 Defect Pixel Correction (DPC) to capture high-quality SWIR images beyond 1.7 µm.

Goldeye XSWIR cameras are available with two sensor options. The 1.9µm version detects light between 1,100nm to 1,900nm and the 2.2 µm version from 1,200 – 2,200nm.

Response curves for two respective sensors; images courtesy of Allied Vision

Industrial grade solution for an attractive price: Other sensor technologies available to detect light beyond 1,700 nm based on materials like HgCdTe (MCT), Type-II Superlattice (T2SL), or Colloidal Quantum Dots (CQD) tend to be very expensive. The Goldeye XWIR Extended Range (ER) InGaAs sensors have several advantages including cost-effective sensor cooling via TEC, high quantum efficiencies, and high pixel operability (> 98.5%).

MCT or T2SL sensor-based SWIR cameras typically require a very strong sensor cooling using Stirling coolers or TEC3+ elements. By comparison the Goldeye XSWIR cameras are available for a comparatively low price.

The easy integrability and operation of ER InGaAs sensors makes them attractive for industrial applications, including but not limited to:

  • Laser beam analysis
  • Spectral imaging in industries like recycling, mining, food & beverages, or agriculture
  • Medical imaging: e.g. tissue imaging due to deeper penetration of longer wavelengths
  • Free Space Optics Communication
  • Surveillance

1st Vision’s sales engineers have over 100 years of combined experience to assist in your camera and components selection.  With a large portfolio of lensescablesNIC card and industrial computers, we can provide a full vision solution!
Note: All images courtesy of Allied Vision Technologies.

Which Z-Trak 3D camera is best for my application?

So you want to do an in-line measurement, inspection, identification and/or guidance application in automotive, electronics, semiconductor or factory automation. Whether a new application or time for an upgrade, you know that Teledyne DALSA’s Z-Trak 3D Laser Profiler balances high performance while also offering a low total cost of ownership.

In this 2nd Edition release we update the Z-Trak family overview with the addition of the new LP2C 4k series, bringing even more options along the price : performance spectrum. From low cost and good enough, through more resolution as well as fast, and all the way to highest resolution, there are a range of Z-Trak profiles to choose from.

Z-Trak 3D Laser Profiler

The first generation Z-Trak product, the LP1, is the cornerstone of the expanded Z-Trak family, now augmented with the Z-Trak2 group (V-series and the S-series), plus the LP2C 4k series. Each product brings specific value propositions – here we aim to help you navigate among the options.

Respecting the reader’s time, key distinctions among the series are:

  • LP1 is the most economical 3D profiler on the market – contact us for pricing.
  • Z-Trak2 is one of the fastest 3D profilers on the market – with speeds to 45kHz.
  • LP2C 4k provides 4,096 profiles per second at resolution down to 3.5 microns.

To guide you effectively to the product best-suited for your application, we’ve prepared the following table, and encourage you to fill in the blanks, either on a printout of the page or via copy-past into a spreadsheet (for your own planning or to share with us as co-planners).

3D application key attributes

Compare your application’s key attributes from above with some of the feature capacities of the three Z-Trak product families below, as a first-pass at determining fit:

Z-Trak Series' overvivew

Unless the fit is obvious – and often it is not – we invite you to send us your application requirements. We we love mapping customer requirements, so please send us your application details in our form on this contact link; or you can send us an email to info@1stvision.com with the feedback from your 3D application’s “Key questions” above.

In addition to the parameter-based approach to choosing the ideal Z-Trak model, we also offer an empirical approach – send in your samples. We have a lab set up to inspect customer samples with two or more candidate configurations. System outputs can then be examined for efficacy relative to your performance requirements, to determine how much is enough – without over-engineering.

1st Vision’s sales engineers have over 100 years of combined experience to assist in your camera and components selection.  With a large portfolio of lensescablesNIC card and industrial computers, we can provide a full vision solution!
Note: This is the 2nd edition of a blog originally published December 16, 2022, now augmented with the Z-Trak LP2C 4k series.

How to read an MTF lens curve

We recently published a TechBrief “What is MTF?” to our Knowledge Base. It provides an overview of the Modulation Transfer Function, also called the Optical Transfer Function, and why MTF provides an important measure of lens performance. That’s particularly useful when comparing lenses from different manufacturers – or even lenses from different product families by the same manufacturer. With that TechBrief as the appetizer course, let’s dig in a little deeper and look at how to read an MTF lens curve. They can look a little intimidating at first glance, but we’ll walk you through it and take the mystery out of it.

Figure A. Both images created with lenses nominally for similar pixel sizes and resolution – which would you rather have in your application?

Test charts cluster alternating black and white strips, or “line pairs”, from coarse to fine gradations, varying “spatial frequency”, measured in lines / mm, in object space. The lens, besides mapping object space onto the much smaller sensor space, must get the geometry right in terms of correlating each x,y point to the corresponding position on the sensor, to the best of the lens’ resolving capacity. Furthermore, one wants at least two pixels, preferably 3 or more, to span any “contrast edge” of a feature that must be identified.

So one has to know the field of view (FOV), the sensor size, the pixel pitch, the feature characteristics, and the imaging goals, to determine optical requirements. For a comprehensive example please see our article “Imaging Basics: How to Calculate Resolution for Machine Vision“.

Figure B. Top to bottom: Test pattern, lens, image from camera sensor, brightness distribution, MTF curve

Unpacking Modulation Transfer Function, let’s recall that “transfer” is about getting photons presented at the front of the lens, coming from some real world object, through glass lens elements and focused onto a sensor consisting of a pixel array inside a camera. In addition to that nifty optical wizardry, we often ask lens designers and manufacturers to provide lens adjustments for aperture and variable distance focus, and to make the product light weight and affordable while keeping performance high. “Any other wishes?” one can practically hear the lens designer asking sarcastically before embarking on product design.

So as with any complex system, when transferring from one medium to another, there’s going to be some inherent lossiness. The lens designer’s goal, while working within the constraints and goals mentioned above, is to achieve the best possible performance across the range of optical and mechanical parameters the user may ask of the lens in the field.

Consider Figure B1 below, taken from comprehensive Figure B. This shows the image generated from the camera sensor, in effect the optical transfer of the real world scene through the lens and projected onto the pixel array of the sensor. The widely-spaced black stripes – and the equally-spaced white gaps – look really crisp with seeming perfect contrast, as desired.

Figure B1: Image of progressively more line pairs per millimeter (lp/mm)

But for the more narrowly-spaced patterns, light from the white zones bleeds into the black zones and substantially lowers the image contrast. Most real world objects, if imaged in black and white, would have shades of gray. But a test chart, at any point position, is either fully black or fully white. So any pixel value recorded that isn’t full black or full white represents some degradation in contrast introduced by the lens.

The MTF graph is a visual representation of the lens’ ability to maintain contrast across a large collection of sampled line pairs of varying widths.

Let’s look at Figure B2, an example MTF curve:

Figure B2: Example of MTF graph
  • the horizontal axis denotes spatial frequency in line pairs per millimeter; so near the origin on the left, the line pairs are widely spaced, and progressively become more narrowly spaced to the right
  • the vertical axis denotes the modulation transfer function (MTF), with high values correlating to high contrast (full black or full white at any point), and low values representing undesirable gray values that deviate from full black or full white

The graph in Figure B2 only shows lens-center MTF, for basic discussions, and does not show performance on edges, nor take in account f# and distance. MTF, and optics more generally, are among the more challenging aspects of machine vision, and this blog is just a primer on the topic.

Click to contact
Give us some brief idea of your application or your questions –
we will contact you to assist

In very general terms, we’d like a lens’ MTF plot to be fairly close to the Diffraction Limit – the theoretical best-case achievable in terms of the physics of diffraction. But lens design being the multivariate optimization challenge that it is, achieving near perfection in performance may mean lots of glass elements, taking up space, adding weight, cost, and engineering complexity. So a real-world lens is typically a compromise on one or more variables, while still aiming to achieve performance that delivers good results.

Visualizing correlation between MTF plot and resultant image – MORITEX North America

How good is good enough? When comparing two lenses, likely in different price tiers that reflect the engineering and manufacturing complexity in the respective products, should one necessarily choose the higher performing lens? Often, yes, if the application is challenging and one needs the best possible sensor, lighting and lensing to achieve success.

But sometimes good enough is good enough. It depends. For example, do you “just” need to detect the presence of a hole, or do you need to accurately measure the size of the hole? The system requirements for the two options are very different, and may impact choice of sensor, camera, lens, lighting, and software – but almost certainly sensor and lensing. Any lens can find the hole, but a lens capable of high contrast is needed for accurate measurement.

Here’s one general rule of thumb: the smaller the pixel size, the better the optics need to be to obtain equivalent resolution. As sensor technology evolves, manufacturers are able to achieve higher pixel density in the same area. Just a few years ago the leap from a VGA sensor to 1 or 5 MegaPixels (MP) was considered remarkable. Now we have 20 and 50 MP sensors. That provides fantastic options to systems-builders, creating single-camera solutions where multiple cameras might have been needed previously. But it means one can’t be careless with the optical planning – in order to achieve optimal outcomes.

Not all lens manufacturers express their MTF charts identically, and testing methods vary somewhat. Also, note that many provide two or even three lens families for each category of lenses, in order to provide customers with performance and pricing tiers that scale to different solutions requirements. To see an MTF chart for a specific lens, click first on a lens manufacturer pages such as Moritex, then on a lens family page, then on a specific lens. Then find the datasheet link, and scroll within the datasheet PDF to find the MTF curves and other performance details.

Contact us for a quote

Besides the theoretical approach to reading specifications prior to ordering a lens, sometimes it can be arranged to send samples to our lab for us to take sample images for you. Or it may be possible to test-drive a demo lens at your facility under your conditions. In any case, let us help you with your component selection – it’s what we do.

Finally, remember that some universities offer entire degree programs or specializations in optics, and that an advanced treatment of MTF graph interpretation could easily fill a day-long workshop or more – assuming attendees met certain prerequisites. So this short blog doesn’t claim to provide the advanced course. But hopefully it boosts the reader’s confidence to look at MTF plots and usefully interpret lens performance characteristics.

1st Vision’s sales engineers have over 100 years of combined experience to assist in your camera and components selection.  With a large portfolio of lensescablesNIC card and industrial computers, we can provide a full vision solution!
Acknowledgement / Credits: Special thanks to MORITEX North America for permission to include selected graphics in this blog. We’re proud to represent their range of lenses in our product offerings.